The Missing Middle - Towards Universal and Affordable Health Coverage
In 2019, India spent ₹6.13 lakh crores (trillion) on healthcare, accounting for about 3% of GDP. India’s spend on healthcare as a share of GDP is among the lowest in G20 countries. Over 30% of India’s population has no health insurance and over 60% of the healthcare spend is attributed to out-of-pocket expenditures. India also has amongst the lowest costs for delivering quality healthcare, making it an attractive destination for cross-border medical tourism. India’s life expectancy, which is one of the most frequently used health status indicators, has also been increasing consistently.
About 30% of India’s population is covered by government insurance, social health schemes, and private insurance. In 2018, India introduced the Ayushman Bharat health scheme providing health insurance coverage to roughly the bottom 40% of the country. That leaves 30% of the population vulnerable to financial hardships and medical debt in the event of adverse health events. This population segment, which is about 100 million households, constitutes the ‘missing middle,’ who lack any financial protection for health - not poor enough to avail of government health subsidies and not rich enough to afford private health insurance.
The missing middle households are characterized by informal employment with unstable incomes, on average earning between ₹30,000 to ₹80,000 per month. While they may not have the financial capacity to pay for the costs of certain medical procedures, they do have the capacity to pay insurance premiums. A monthly premium of ₹1,000 per household for this segment is affordable and would provide an additional ₹1.2 trillion (about $15 billion) per year towards healthcare.
A health insurance product for the missing middle can net an additional ₹1.2 trillion in revenues to healthcare providers and insurers. For the insurance product to work, the missing middle’s ability to pay must convert to a willingness to pay. A willingness to pay will require transparent pricing, comprehensive coverage, and a frictionless patient experience from the insurer. It will require positive health outcomes and patient satisfaction. How do we structure this insurance product so that the missing middle sees value and is willing to pay?
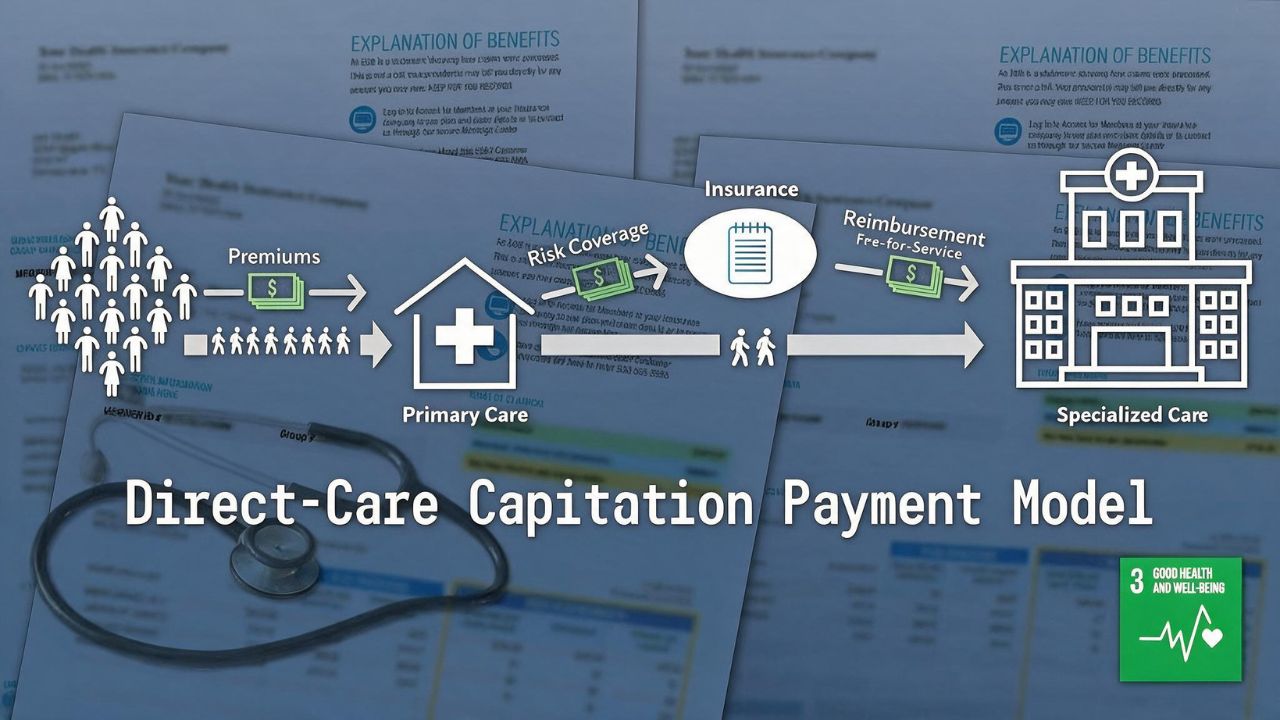
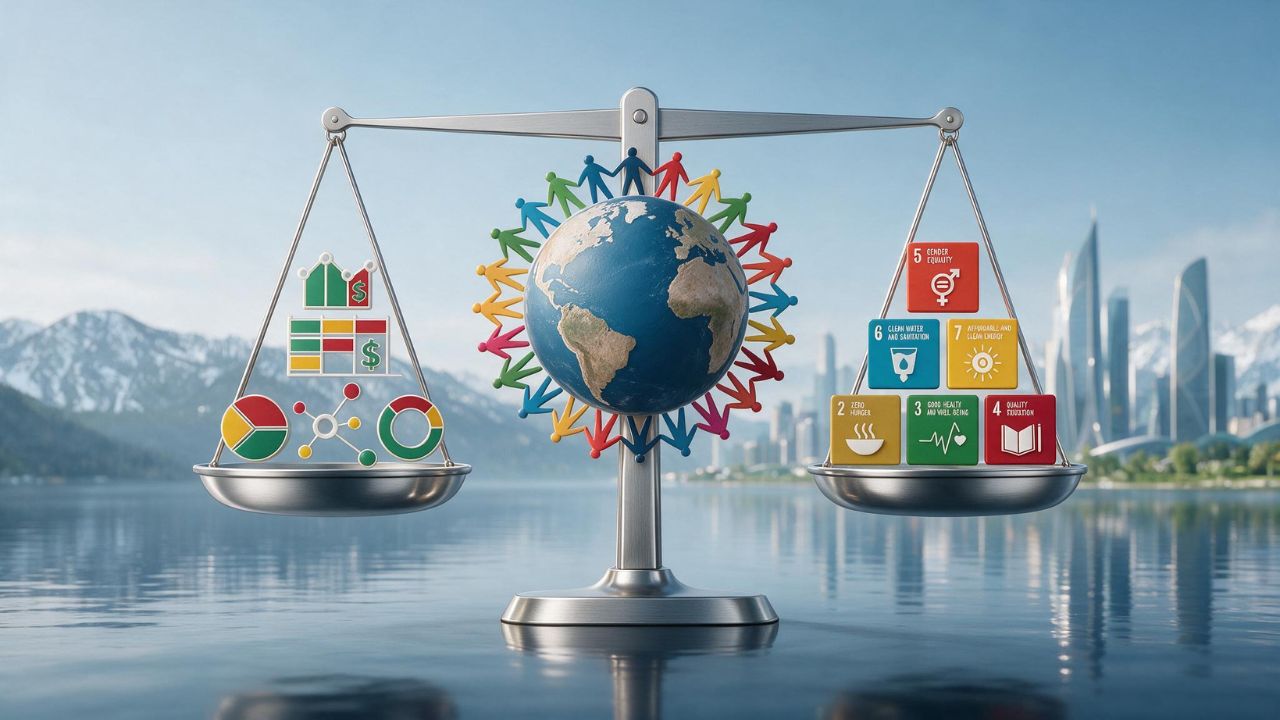
The UN Sustainable Development Goals (SDG) has a 2030 target of universal and affordable healthcare. We look at national healthcare models, historical data, and patient narratives, and propose a new model for healthcare, the Direct-Care Capitation Payment model. It right-aligns market forces to keep costs in check, cuts down waste, and puts the focus on wellness and quality of life. It will provide universal and affordable health insurance. It will create resilient communities, profitable healthcare businesses, and increase social capital. It will put India on a sustainable path to meet its SDG 3 targets by the year 2030. It can serve as a model for other countries of the Global South.
Comparing National Healthcare Models
There are four distinct national models for providing healthcare – the Beveridge model (UK), the Bismarck model (Germany), the Tommy Douglas model (Canada) , and the Out-of-Pocket model (practiced in India and most countries of the Global South).
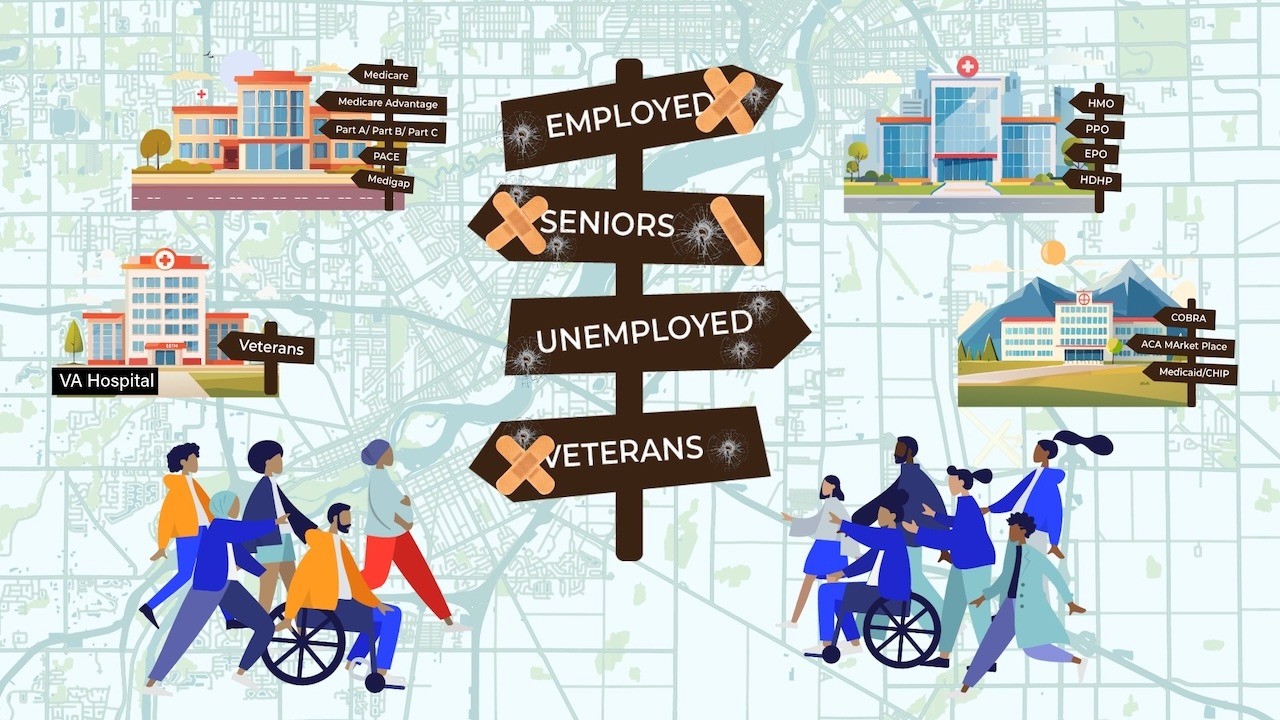
In the US, all four healthcare models exist for different population segments. The Veterans Health Administration runs an integrated healthcare system similar to the UK’s National Health Service. Employer-based plans that offer private health insurance are similar to the Germany model (except for the fact that insurance is for-profit). Medicare is a single payer model available to seniors over 65 and is similar to the Canada model. The Out-of-Pocket model is used for procedures like cosmetic surgery, which are typically not covered by insurance. Since all the models are in use, we can use US healthcare data to get insights into cost trends for each of these models.
For healthcare costs, we used data from the Centers for Medicare and Medicaid Services (CMS) and the Aesthetic Institute. The inflation data is from the US Bureau of Labor Statistics (BLS). We used the year 2000 as a baseline and normalized all the costs to $1,000. Data for Medicare, Veterans Affairs, and Private Health Insurance is from CMS. We took the yearly totals and adjusted them for population to get per-capita costs. For the Out-of-Pocket model, we summed the average costs for three of the more popular cosmetic surgery procedures - Breast Augmentation, Liposuction, and Rhinoplasty - over the years. The figure below shows the rise in costs for the different models from the year 2000 to 2021.
| Model | % Increase in Costs (2000 - 2021) |
|---|---|
| UK model (Socialized Healthcare) | 374% |
| Canada model (Single-Payer Socialized Insurance) | 242% |
| Germany model (Private Non-Profit Insurance) | 134% |
| Consumer Price Index | 54% |
| Out-of-Pocket model | 40% |
The UK model’s costs went up about 7x inflation in two decades. The Canada model’s costs went up over 4x inflation in the same period. The cost of the Germany model went up about 2.5x.
The costs for the Out-of-Pocket model, when adjusted for inflation, declined over the same period. The Out-of-Pocket model shows that when there is price transparency, consumer choice, and no third-party intermediating payments, medical services can be provided at much lower costs. In the UK model, the government is the provider and the payer. In the Canada model, the government is the single payer. The data also shows that greater the government intervention, the higher the costs.
Anecdotal evidence from the out-of-pocket model in India supports this. Actual costs for many major medical procedures are less today than what it was two decades earlier. Taking inflation into account, costs for diagnostic tests, cardiac surgeries, dialysis, etc. are not just lower but significantly more affordable today.
What Narayana Hrudalaya did for cardiac surgeries, the Aravind Eye Hospital has done for eye surgeries. Tata Memorial Hospital has assembly-lined low-cost chemo cycles. Healthcare startups have modularized infrastructure and equipment which has brought down costs of dialysis from thousands of rupees to hundreds of rupees (less than $12 per session). With local innovation, technology, modularization, and specialization, India has shown that quality healthcare can be sustainably delivered and made accessible and affordable at scale.
The Canada model and the UK model are both under stress today. They are characterized by staff shortages and increased waiting time for care that will require billions of dollars in new federal spending to fix. This increase in waiting times has fueled the rise of the concierge model of healthcare, a two-tier system where those who can pay skip the queues. These countries already spend a significantly higher proportion of their GDP on healthcare compared to India.
It is generally recommended that countries like India should increase their total healthcare spending to at least 5% of GDP to meet SDG 3 targets. The US is trending towards spending close to 20% of GDP on healthcare and is not on track to meet the SDG 3 target of universal and affordable health coverage. Is increased spending a guarantor of better health outcomes?
National Health Spending and Health Outcomes
The Organization for Economic Cooperation and Development (OECD) publishes data annually about the health systems of its member countries. The figure below shows how India’s healthcare spend over the years compares to other countries that have different national healthcare models.
| Country | Life Expectancy (2000) | Life Expectancy (2021) | % Increase 2000-2021 |
|---|---|---|---|
| Canada | 79.3 | 82.66 | 4.23 |
| Germany | 78.3 | 80.9 | 3.32 |
| India | 62.5 | 69.9 | 11.84 |
| U.K. | 77.9 | 81.52 | 4.64 |
| U.S. | 76.8 | 76.1 | -0.91 |
While life expectancy is an indicator of the quality of care, it is not an indicator of the quality of life. Medical advances have meant that people are living longer with illnesses. A higher life expectancy should not be necessarily correlated to a better outcome for a healthcare model. A better metric would be the healthy-life expectancy. Primary care that allows for early detection and interventions, preventive care, and community health programs that focus on wellness and quality of life can improve the healthy-life expectancy for countries.
Noam Levey contrasted the healthcare system and quality of life in Germany and the US by comparing the Saarland region in Germany with West Virginia. Saarland and West Virginia are coal regions with economies predominantly based around mining. Both Germany and the US have a mostly private healthcare model, where healthcare and insurance is provided by private players. The visualization below shows that both regions are comparable on life satisfaction and other social metrics except when it comes to health.
| Payer | Coverage Volume | Actual Costs |
|---|---|---|
| Public Sector and Private Insurers | 10% (over 30 million households) | 10% - 20% below GIPSA rate. |
| CGHS and SGHS (Central and State Government Health Schemes) | 10% (over 30 million households) | 20% - 30% below GIPSA rate. Most network hospitals are government run which further reduces costs. |
| Ayushman Bharat | 40% (over 120 million households) | 30% - 40% below GIPSA rate |
| Uninsured (Cash Payments) | 40% (over 120 million households) | 50% below GIPSA rate |
With black-box and differential pricing, most patients have no idea what a hospital procedure will cost. Costs for the same procedures vary across hospitals and across plans. In addition, differential rates exist for patients in private cabins and general wards. This creates a preferred-selection problem, where insurers prefer certain hospitals as they have to pay less and hospitals prefer certain insurers as they get paid more. The patient is caught in the middle of this information asymmetry and may be forced to juggle between a private cabin and general ward to manage costs, even with the best private insurance.
Some hospital networks have a cashless arrangement with the insurer where medical expenses are directly settled between the insurer and the provider. These Cashless Health Insurance plans are paid at further discounted rates which disincentivizes hospital networks from offering this option. Even with cashless arrangements, most hospitalizations require you to pay upfront and reconcile later. This adds to the stress and can be overwhelming for patients and their families. It is not unusual to seek funding from family, friends, and even online crowd-funding platforms like Ketto and GoFundMe. While patients worry about getting better, the families worry about their ability to raise the money to pay for the care.
If the option for cashless claim is not available, then a reimbursement claim must be filed. Claims can take weeks to be reimbursed. Filing a claim is not for the faint of heart – along with the filled claim form, a copy of the health card, investigation reports, hospital discharge summary, original medicine and hospital bills, original bill payment receipts, copy of a KYC document, and NEFT details may have to be provided. If any document is left out, reimbursements are further delayed.
Most insurance providers and third-party administrators provide online portals for submitting claims. This process is no less daunting for most. The portals are unintuitive, uninclusive, and fairly inaccessible. Bills, payment receipts, discharge summary, etc. have to be scanned and attached to online forms. The Multiple Indicator Survey in India report of the National Sample Survey Office stated that 84% of internet users don’t know how to send an email with attachments. For many, smaller claim amounts are simply not worth pursuing. This is reflected in the low claims ratio, which ranges between 64% and 72.5% for the health insurers .
Misaligned incentives between the provider and the payer has created a healthcare system designed to create medical debt. In the US, the Affordable Care Act of 2010 has led to higher deductibles and increased out-of-pocket costs, with about a 100 million people now living with medical debt .
Indian health insurance products have been designed based on US insurance products, which are characterized by a lack of comprehensive coverage, annual limits, exclusions, and a lack of transparency on costs. In addition, the pay-first, claim-later model of insurance is systematically pushing patients deeper and deeper into debt. Niti Aayog reports that about a quarter of the population incur catastrophic health expenditures and 7% of India’s population is pushed into poverty every year because of healthcare costs.
Misaligned Incentives
The figure below shows the various insurance payment models that Medicare has experimented with in an attempt to control costs and cut waste. The cost of CMS programs have not just gone up year-to-year, the rate of growth has increased over time. Medicare spending increased 8.4% to $900.8 billion in 2021, accounting for 21% of the total spending on healthcare ($4.3 trillion).
| Current Healthcare Model (2021 Data) | Direct-Care Capitation Payment Model | |
|---|---|---|
| Total cost of health care | $4.3 Trillion | Comparing U.S. Healthcare model with the Direct-Care Capitation Payment Model.56 Trillion |
| Generalists | 100,801 | 1.3 Million |
| Specialists | 765,515 | 200,000 |
| Total Doctors | 866,316 | 1.5 Million |
| Doctors per 1000 | 2.59 | 4.48 |
| Life Expectancy | 76.1 | 81.2 |
India has about 330 million households. Let us assume that a primary care facility can cater to 11,000 households. For the entire country, that would require 30,000 primary care facilities. We will use a model where 10,000 households pay ₹1,000 per month for comprehensive health coverage and 1000 households pay ₹10,000 per month; we can assume that the households paying ₹10,000 get the private cabin experience. That would make for a total healthcare market size of ₹7.2 trillion (about $90 billion), which is less than 3% of India’s 2022 GDP.
| Primary Care Facility | ||
|---|---|---|
| Income | Expense | |
| 10,000 households @ ₹1000 per month, 1000 households at ₹10,000 per month | ₹24 crores | |
| 100 doctors at ₹10 lakhs average per annum | ₹10 crores | |
| 100 nurses + admin staff at ₹5 lakhs average per annum | ₹5 crores | |
| Facility, equipment, community programs | ₹5 crores | |
| Group Risk Insurance Coverage | ₹4 crores | |
Each primary care center buys ₹4 crores in group risk insurance, on average, to cover hospitalizations and specialized care. Considering that there are 30,000 primary care facilities, the health insurance market size is ₹1.2 trillion (about $15 billion); that is the amount available for fee-for-service payments to hospitals.
The Indian government's share of spending on healthcare in 2020 was around 1.5% of GDP. In our model, 300 million households pay ₹1,000 and 30 million households pay ₹10,000 per month. Let us assume that the government pays the ₹1,000 premium for all 300 million households as a direct benefits transfer to the beneficiary's primary care center. The total cost to the government would be ₹3.6 trillion (about $45 billion), which is less than 1.5% of the 2022 GDP. With the Direct-Care Capitation Payment model, the government can provide comprehensive health coverage to 90% of the population without increasing its healthcare share of GDP.
The Direct-Care Capitation Payment model will require 3 million primary care physicians, doubling the number of physicians available today, and providing 2.1 primary care physicians per 1000 of the population. It will incentivize quality and not quantity. It will create a system where the incentive to innovate is rewarded and aligned to patient outcomes. The focus on wellness and prevention will result in a reduction in the volume of treatments and hospitalizations. Hospitals can use this excess capacity to tap into additional high-value revenue streams like cross-border medical tourism .
The Direct-Care Capitation Payment model will eliminate open enrollment nightmares, give you your choice of doctors, significantly reduce costs, increase caregiver salaries, and will improve community health outcomes. Market forces will balance the mix of generalists and specialists, align profits with quality of care and health outcomes, and allow and incentivize providers to focus on primary care and community health. It will prioritize quality of life over quantity of life.
The Direct-Care Capitation Payment model will provide universal and affordable healthcare. It will allow countries to meet SDG 3 targets. It right-aligns market forces, leverages market efficiencies, and will in the longer-term deliver better health outcomes.
The model’s success will be determined by the ability of the system to scale, in its agility to adapt to change, and in its adoption by the people. One of the factors for the high cost of care is the fragmentation of care. Successful implementation of the model will require a shared information digital infrastructure that will allow providers, payers, and patients to seamlessly access information, enabling effective coordination of care and payments.
People, Profits, and the Planet
One of the reasons for the high costs of the healthcare industry today is fragmented information and incompatible IT systems across healthcare providers and insurers. Patient records are siloed and unavailable across providers and payers. It is not unusual for senior citizens to carry binders of past diagnostic tests, prescriptions, and procedures to physician visits. Physicians rarely have time to look through binders; new tests are ordered, new drugs prescribed, the binder gets thicker. The lack of an integrated healthcare system where patient records can be accessed seamlessly across providers and payers inflates waste and costs, and leads to medical misdiagnoses, repeat testing, inappropriate medications, and polypharmacy.
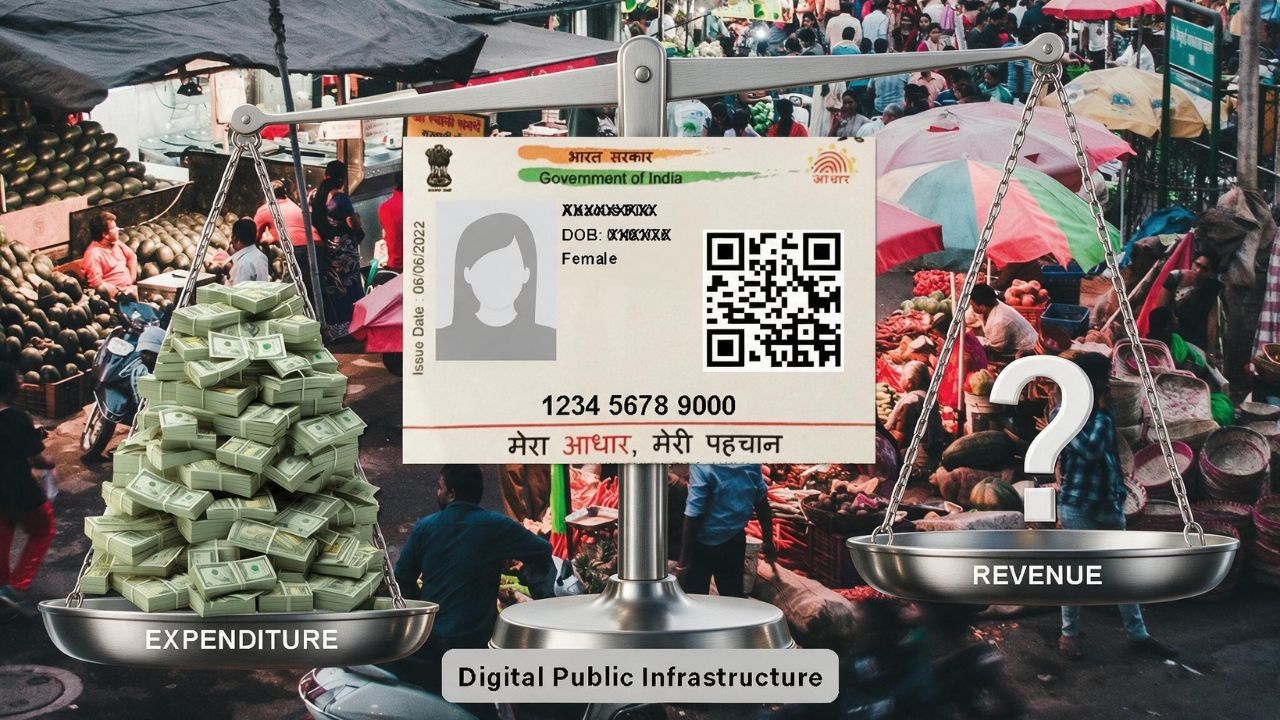
To address this, the Ayushman Bharat Digital Mission is creating the backbone digital infrastructure for an integrated healthcare system, where all stakeholders are connected and can securely access and update patient records. This digital stack will include healthcare facility registries, healthcare professional registries, operational dashboards, and an open API to access digital health services through mobile apps. Direct benefits transfer will allow the government to make beneficiary payments directly to the primary care center of choice.
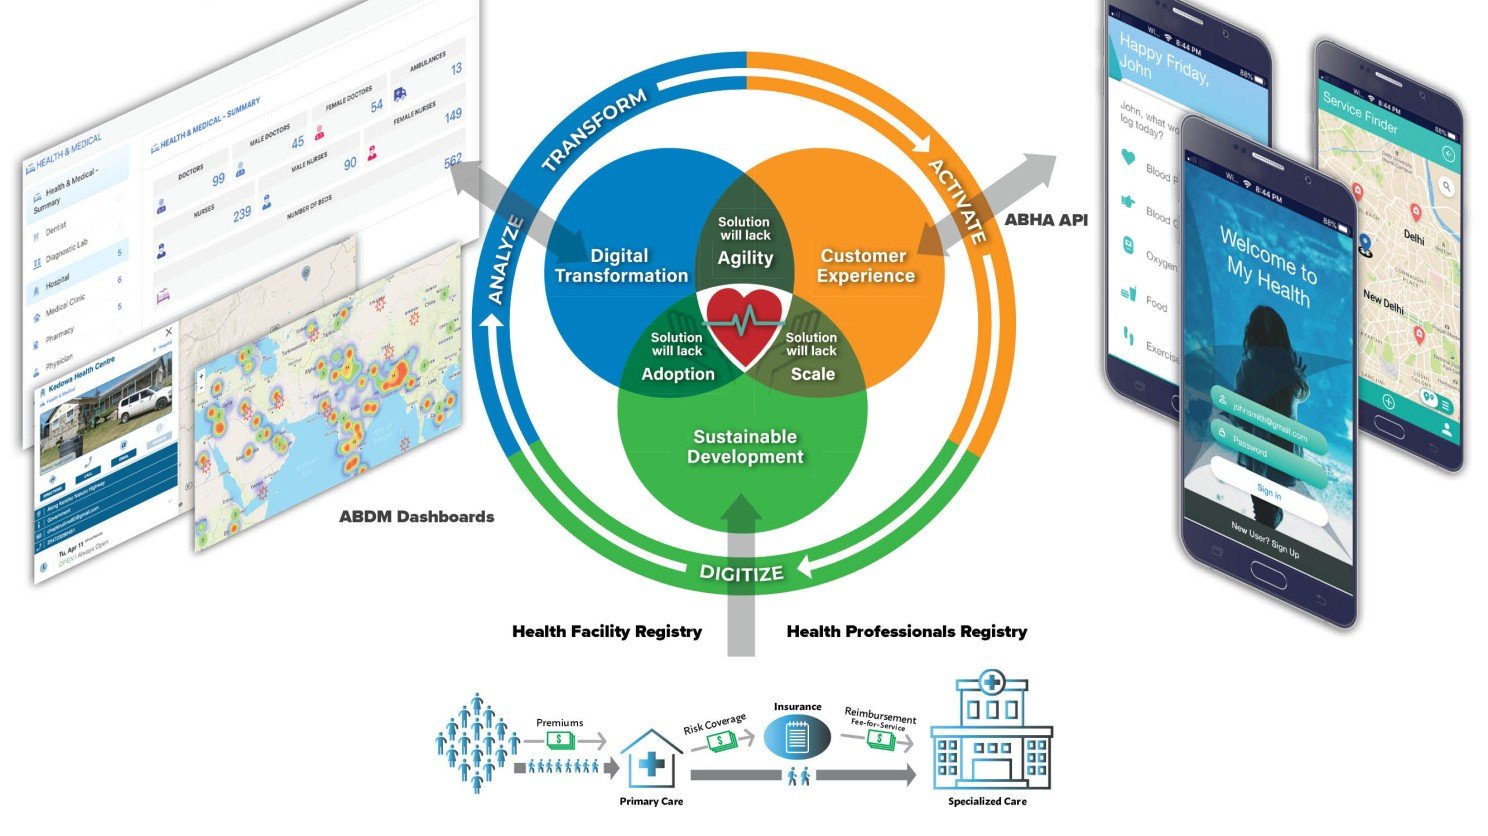
The German national healthcare model has shown that comprehensive coverage and limiting out-of-pocket expenditures does increase social capital. The Indian healthcare model of assembly-lined medical procedures can deliver sustainable value at scale. The digitally integrated Ayushman Bharat digital stack will connect patients, providers, and payers and will provide a seamless experience for all stakeholders. The right healthcare model, the right healthcare digital stack, and a frictionless patient experience will put countries on track towards meeting SDG 3 targets of affordable and universal healthcare.
Right-aligning people, profits, and the planet makes good business sense. The Direct-Care Capitation Payment model will incentivize early interventions, prioritize prevention over treatment, palliation over procedures, and quality of life over quantity of life. It will create resilient communities, profitable healthcare businesses, and increase social capital. It will put India on a sustainable path to meet SDG 3 targets by the year 2030. It can serve as a model for countries of the Global South.
Today, India is recognized as the pharmacy of the world. With the Direct-Care Capitation Payment model, Ayushman Bharat digital stack, and a frictionless patient experience, it has the potential, through cross-border medical tourism, to become the low-cost high-quality healthcare provider to the world. The time to act is now.
References
Goodman J.C. Better Care at One Tenth the Cost. Forbes. Available at https://www.forbes.com/sites/johngoodman/2016/03/02/better-care-at-one-tenth-the-cost/?sh=1bc4964745bc
Chandana H. Devi Shetty’s son has a plan for his ‘Walmart model’ Narayana hospital chain – go cheaper. ThePrint. 21 July, 2019. Available at https://theprint.in/health/devi-shettys-son-has-a-plan-for-his-walmart-model-narayana-hospital-chain-go-cheaper/265209/
Wilcox L. A Market-Creation Story: Aravind Eye Care. The Forum at HBS. Available at https://www.hbs.edu/forum-for-growth-and-innovation/blog/Pages/default.aspx?post=51
Nitnaware H. Man Quits US Job; Now Provides Kidney Dialysis To Rural Patients For Half The Cost. The Better India. Available at https://www.thebetterindia.com/250227/shashank-moddhia-mumbai-startup-renal-project-affordable-kidney-dialysis-in-india-healthcare-him16/
Yousif N. Canada pledges billions to help fix healthcare system. BBC News. February 2023. Available at https://www.bbc.com/news/world-us-canada-64574072
Ziady H. Britain's NHS was once idolized. Now its worst-ever crisis is fueling a boom in private care. CNN Business. February 6, 2023. Available at https://www.cnn.com/2023/02/06/business/nhs-strikes-private-healthcare-uk/index.html
McIntyre D, Meheus F, Røttingen JA. What level of domestic government health expenditure should we aspire to for universal health coverage. Health Economics, Policy and Law, 12(2), 125-137. 23 March 2017. Available at https://www.cambridge.org/core/journals/health-economics-policy-and-law/article/what-level-of-domestic-government-health-expenditure-should-we-aspire-to-for-universal-health-coverage/B03E4FAA9DB51F4C9738CB584C9C8B31
Levey N. Lessons from Germany to help solve the U.S. medical debt crisis. All Things Considered, NPR. Available at https://www.npr.org/sections/health-shots/2022/12/14/1142601526/lessons-from-germany-to-help-solve-the-u-s-medical-debt-crisis
Ministry of Statistics and Programme Implementation. Multiple Indicator Survey in India, NSS 78th round 2020-2021. MoSPI. Available at https://mospi.gov.in/sites/default/files/publication_reports/MultipleIndicatorSurveyinIndiaf_0.pdf
Kumar A, Sarwal R. Health Insurance for India’s Missing Middle. NITI Aayog. October 2021. Available at https://www.niti.gov.in/sites/default/files/2021-10/HealthInsurance-forIndiasMissingMiddle_28-10-2021.pdf
Levey N. Sick and struggling to pay, 100 million people in the U.S. live with medical debt. NPR. June 16, 2022. Available at https://www.npr.org/sections/health-shots/2022/06/16/1104679219/medical-bills-debt-investigation
Harris M, Tayler B. Don’t Let Metrics Undermine Your Business. Harvard Business Review. September - October 2019. Available at https://hbr.org/2019/09/dont-let-metrics-undermine-your-business
John R. The Rash that Cost $1538. Hawkai Data Blog. January 2023. Available at https://www.linkedin.com/pulse/rash-cost-1538-ranjit-john?trk=public_post_feed-article-content
Lunt N, Smith R, Exworthy M, Green S.T, Horsfall D, Mannion R. Medical Tourism: Treatments, Markets and Health System Implications: A scoping review. OECD. Available at https://www.oecd.org/els/health-systems/48723982.pdf
National Health Authority. Ayushman Bharat Digital Mission. Available at https://abdm.gov.in/
Data Sources
Organization for Economic Co-operation and Development (OECD) data is available at https://stats.oecd.org/ and https://www.oecdregionalwellbeing.org/
Centers for Medicare and Medicaid Services (CMS) data is available at https://data.cms.gov/
U.S. Bureau of Labor Statistics (BLS) data is available at https://www.bls.gov/data/
The Aesthetic Society data is available at https://www.theaestheticsociety.org/media/procedural-statistics
Notes
1 lakh = 100,000
1 crore = 10 million
1 lakh crore = 1 trillion
India's 2021 census has been delayed but the United Nations has projected India's population to be over 140 crores. These projections are based on the 2011 census. The Multiple Indicator Survey in India 2020-2021 report from the National Sample Survey Office lists the average household size as 4.3.