Facility-Based Data
| UN SDG | Facility Type | Service Availability | Service Capacity | Service Readiness |
| SDG 3 Good Health and Well-Being | Dentist, Diagnostic Lab, Hospital, Medical Clinic, Pharmacy, Veterinary Care | Services offered, Opening Hours | Number of beds, Number of doctors, Number of nurses | Power Reliability, Primary water source |
| SDG 4 Education for All | Primary School, Secondary School, High School, Vocational, University | Online options | Number of classrooms, Number of teachers, Number of students | Power Reliability, Primary water source |
| Facility Type | Total (in Kericho) | Number Surveyed | % Coverage |
| Pharmacy | 80 | 5 | 6% |
| Hospital/Clinic | 50 | 11 | 22% |
| Colleges/Schools | 15 | 2 | 13% |
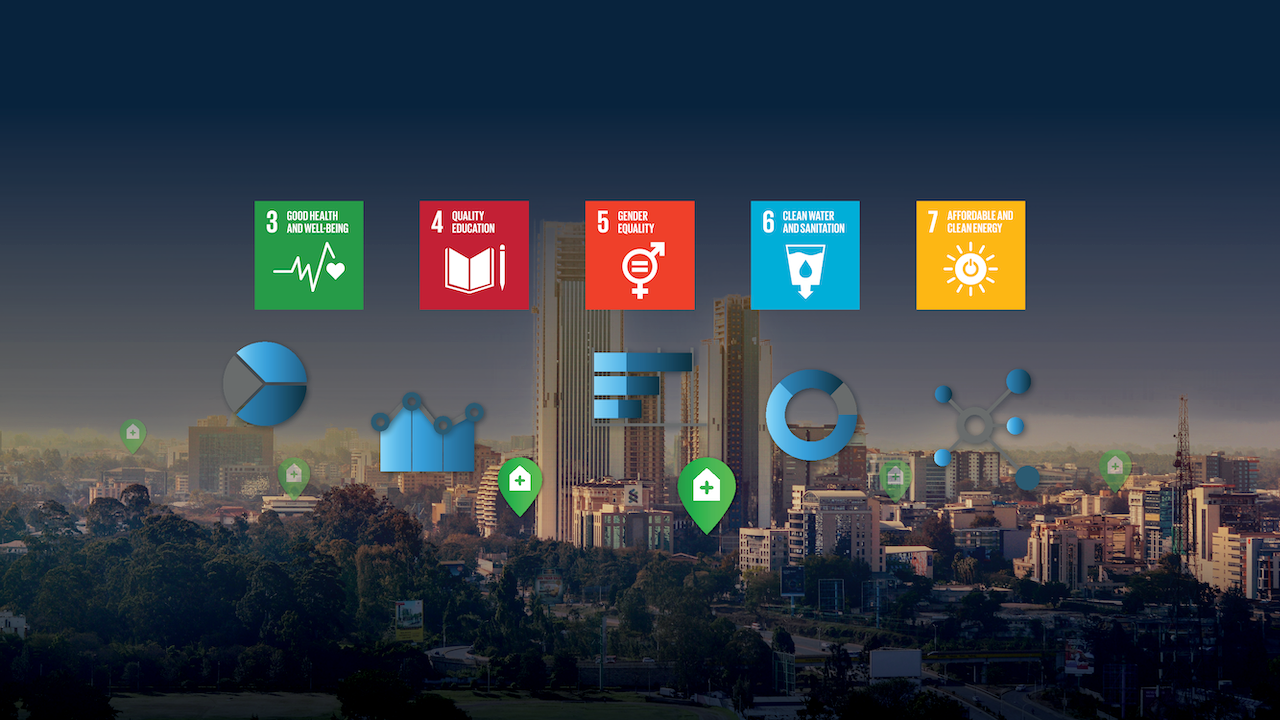
| UN SDG | Desired Outcome | Key Indicator | Desired Target |
| SDG 3 | Improve care capacity | Medical facilities per 100000, Doctors per 1000 population, Beds per 1000 population | 4 facilities per 100000, 3 Doctors per 1000, 4 Nurses per 1000, 5 Beds per 1000 |
| SDG 4 | Improve access to education | Teachers per 1000 students | 10 teachers per 1000 |
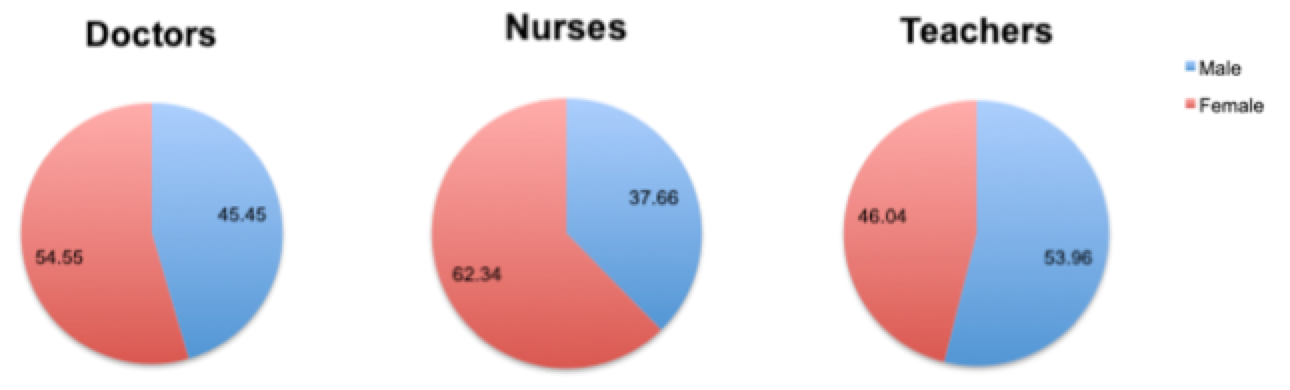
| SDG 5 | Gender equality among doctors, nurses, teachers | Female to Male ratio among doctors | Match local gender mix |
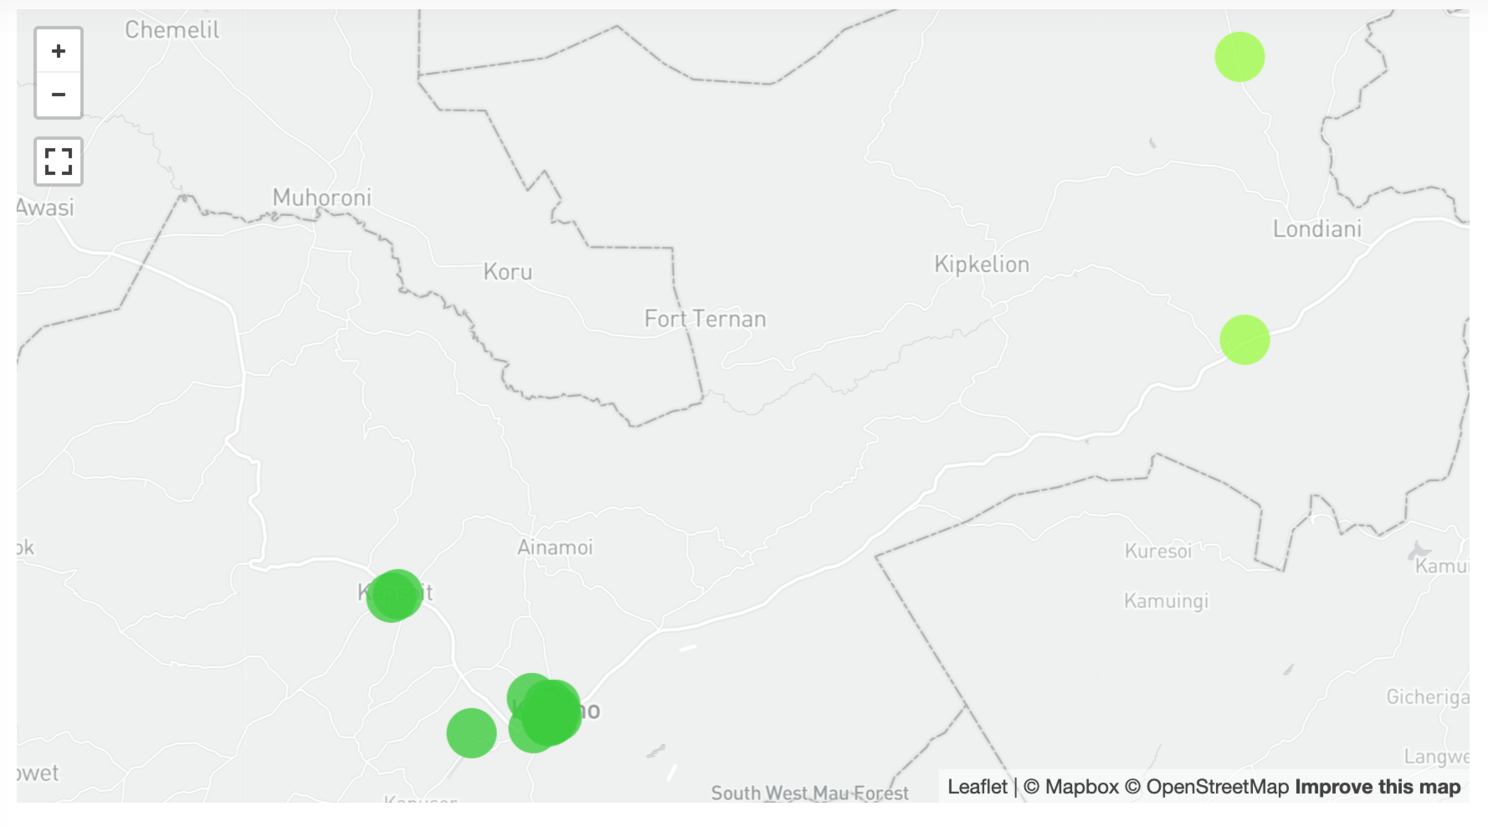
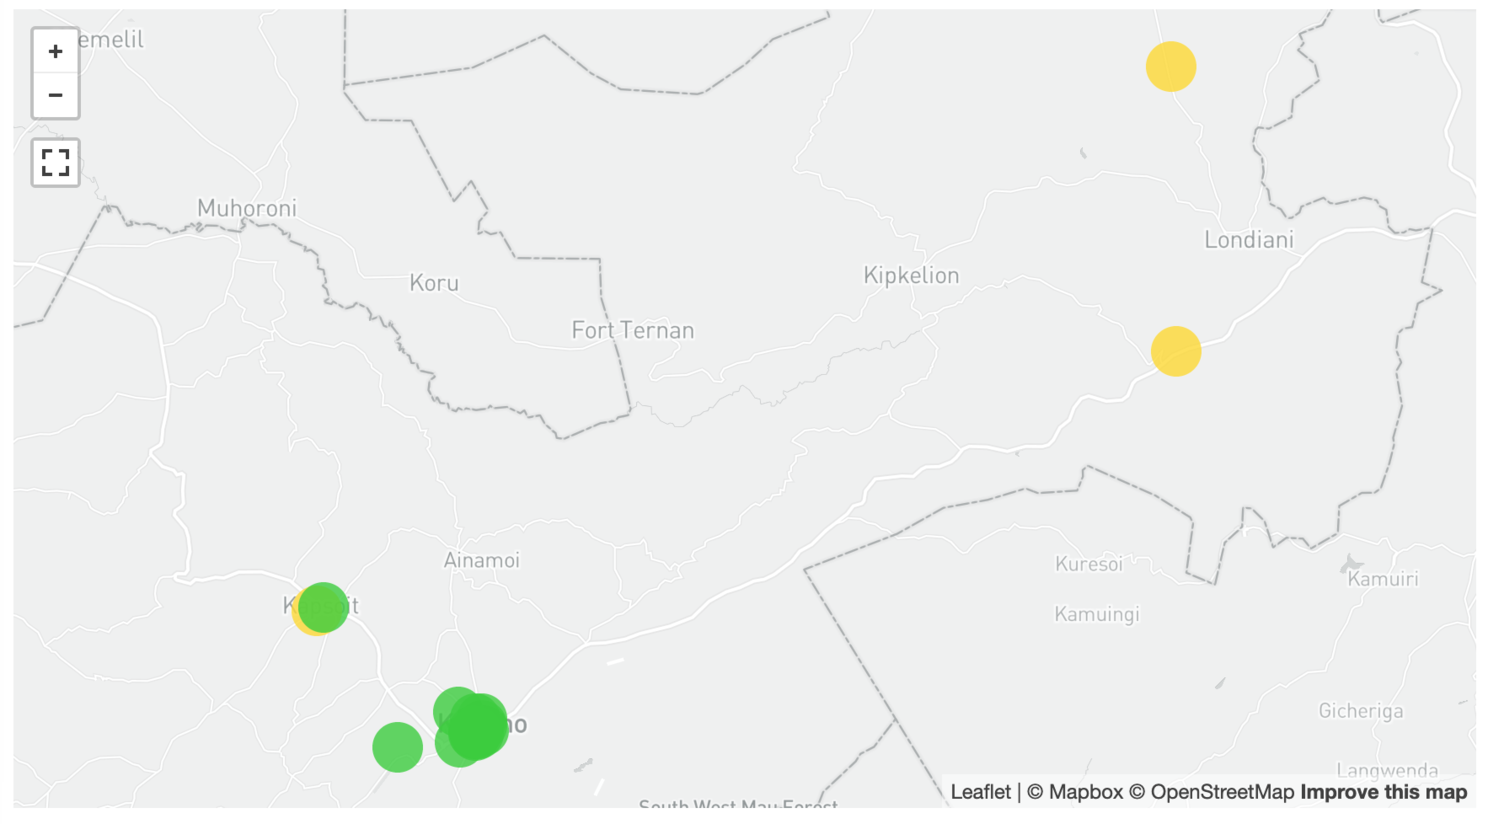
| SDG 6 | Access to safe water | Distribution of safe/unsafe water sources | Safe access to water for all |
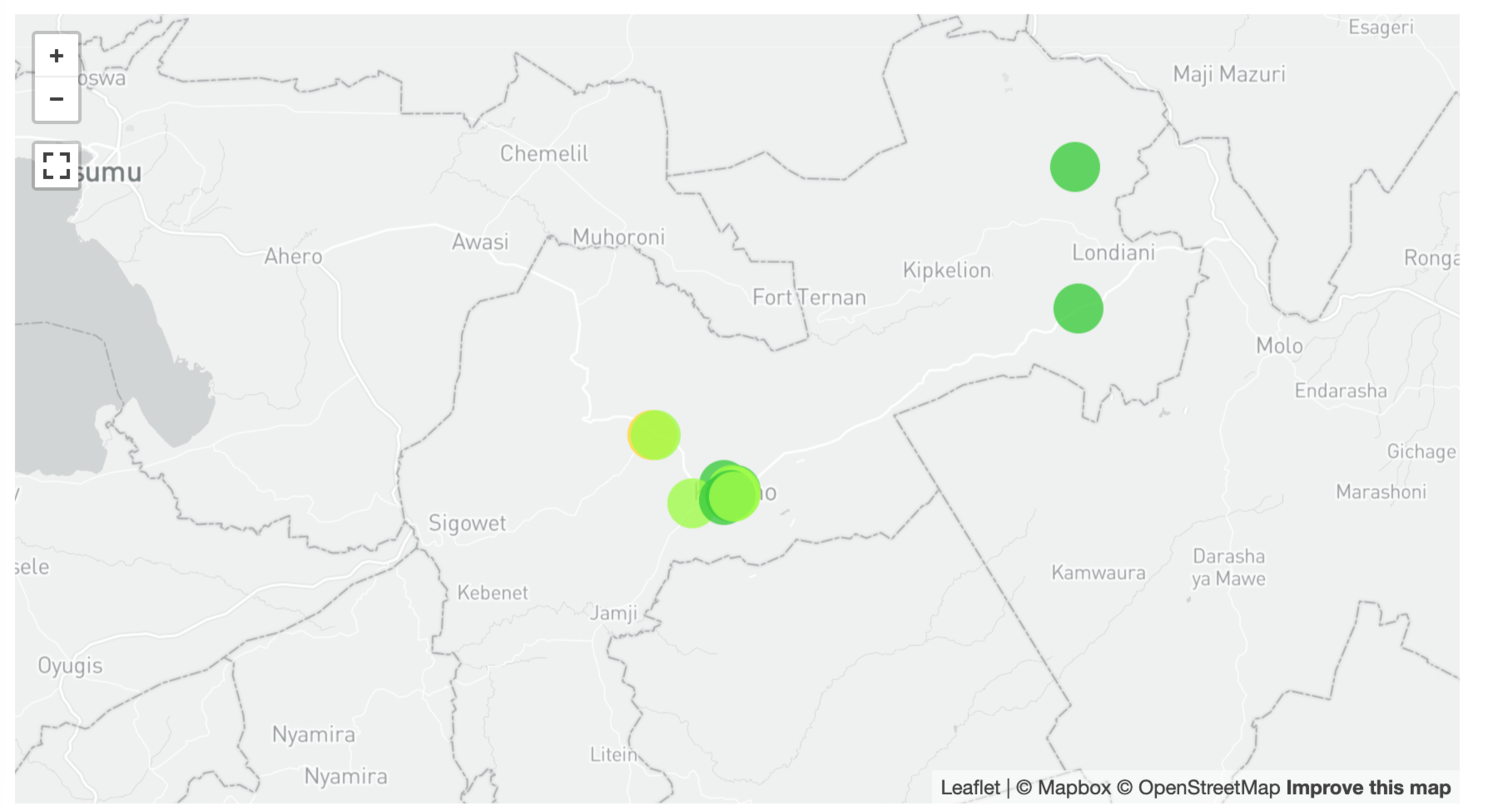
| SDG 7 | Stable access to power | Access to stable power | Access to stable power for all |
SDG Dashboards
SDG 3 (Health for All) Dashboard
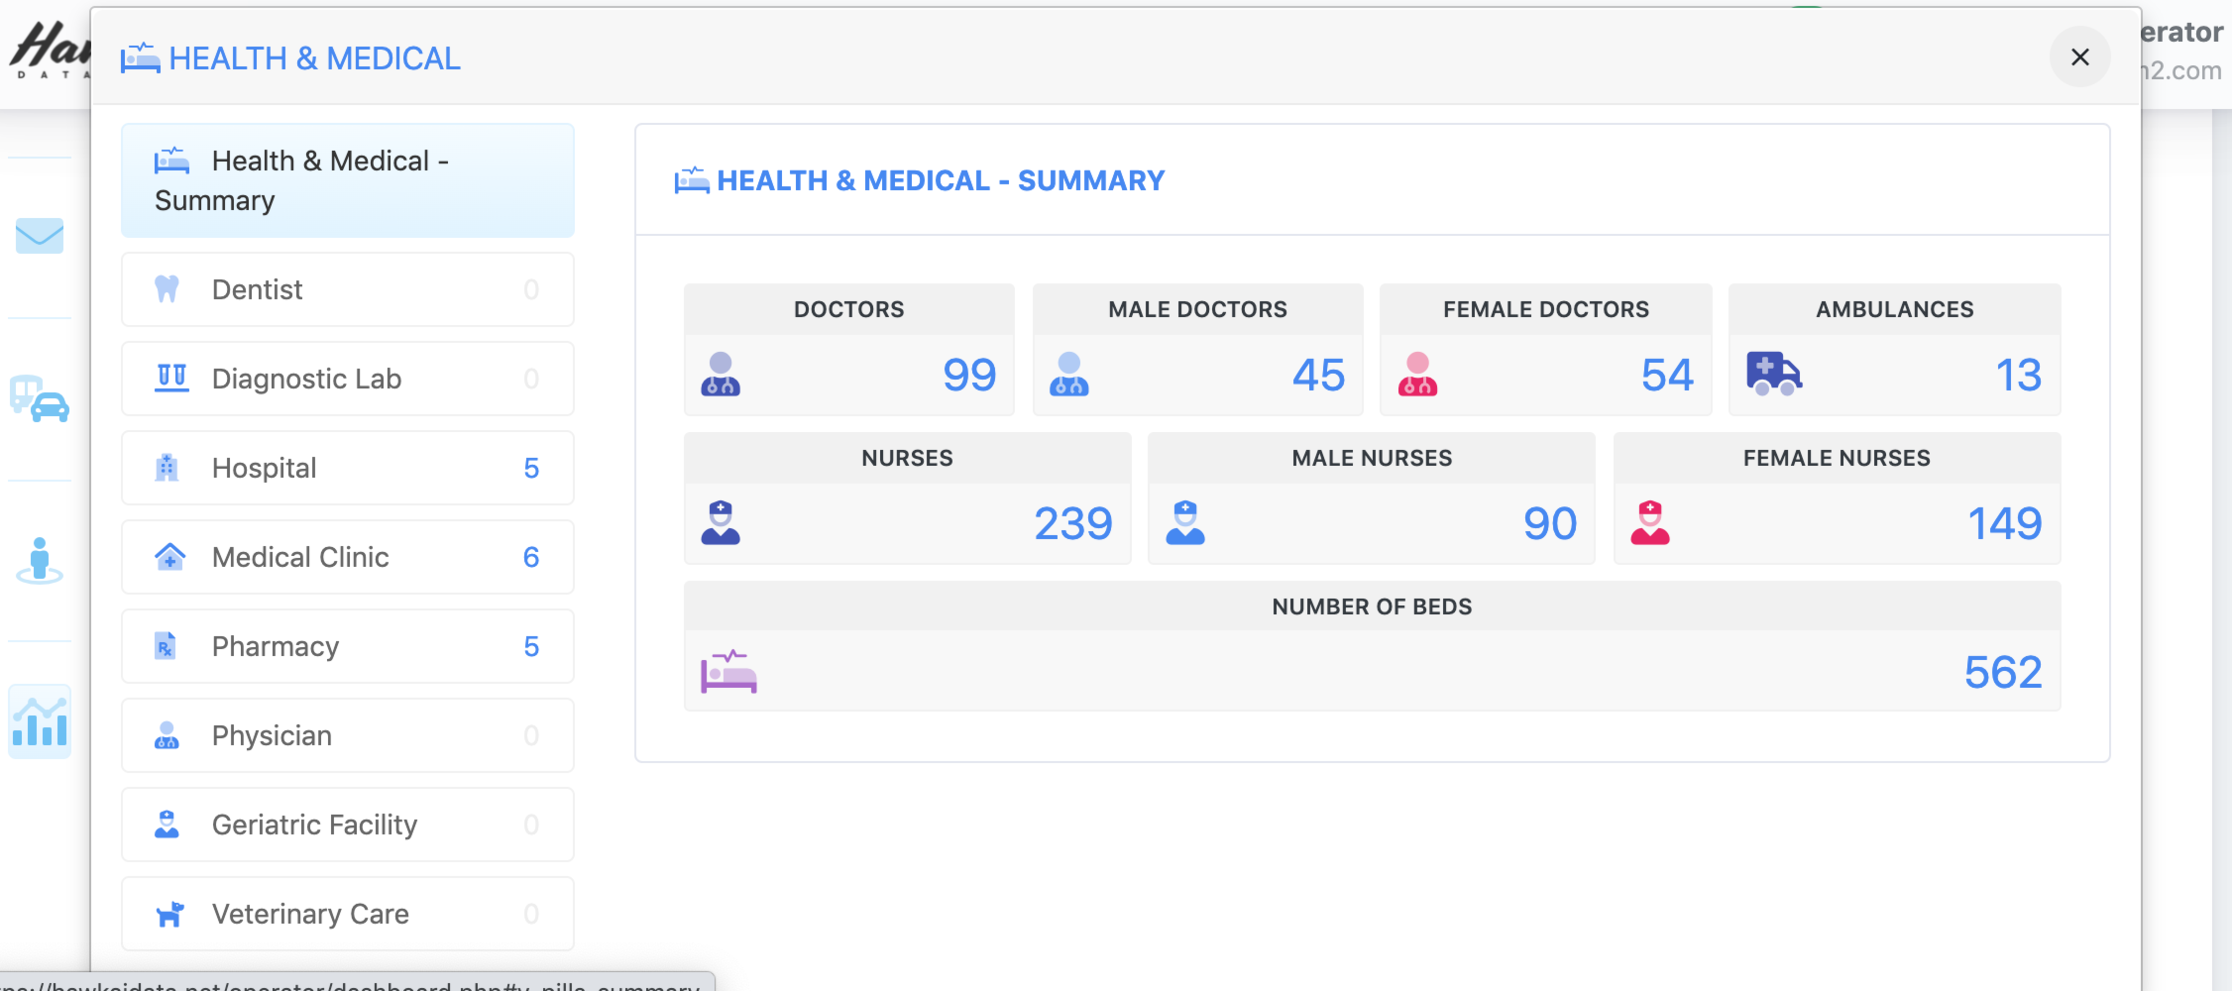
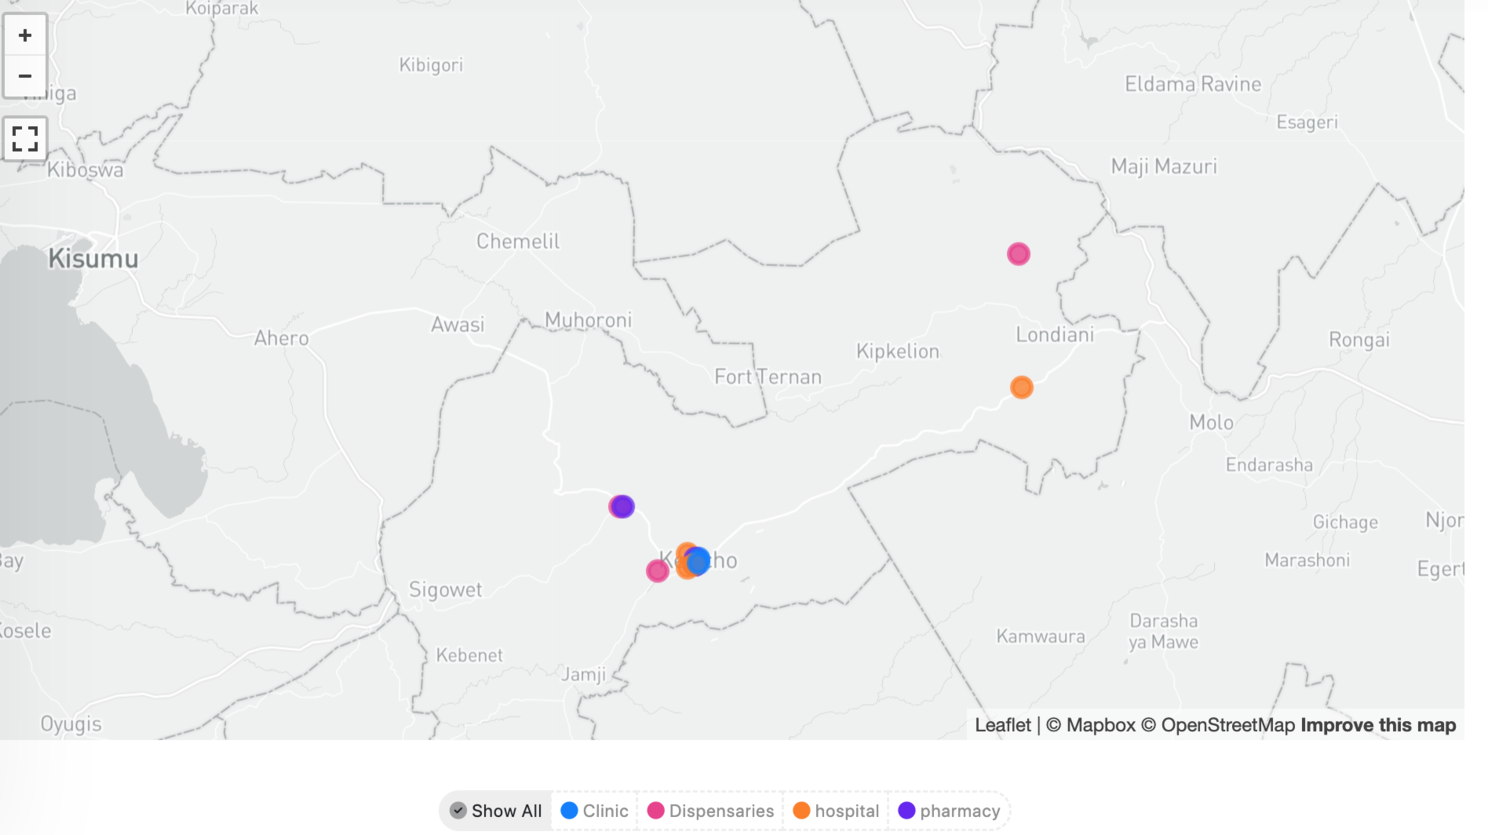
| Total in facilities surveyed | Total in county extrapolated | Kericho County (Baseline metrics) | 2030 SDG Target | |
| Doctors | 99 | 450 | 0.5 | 3 |
| Nurses | 239 | 1086 | 1.2 | 4 |
SDG 4 (Education for All) Dashboard
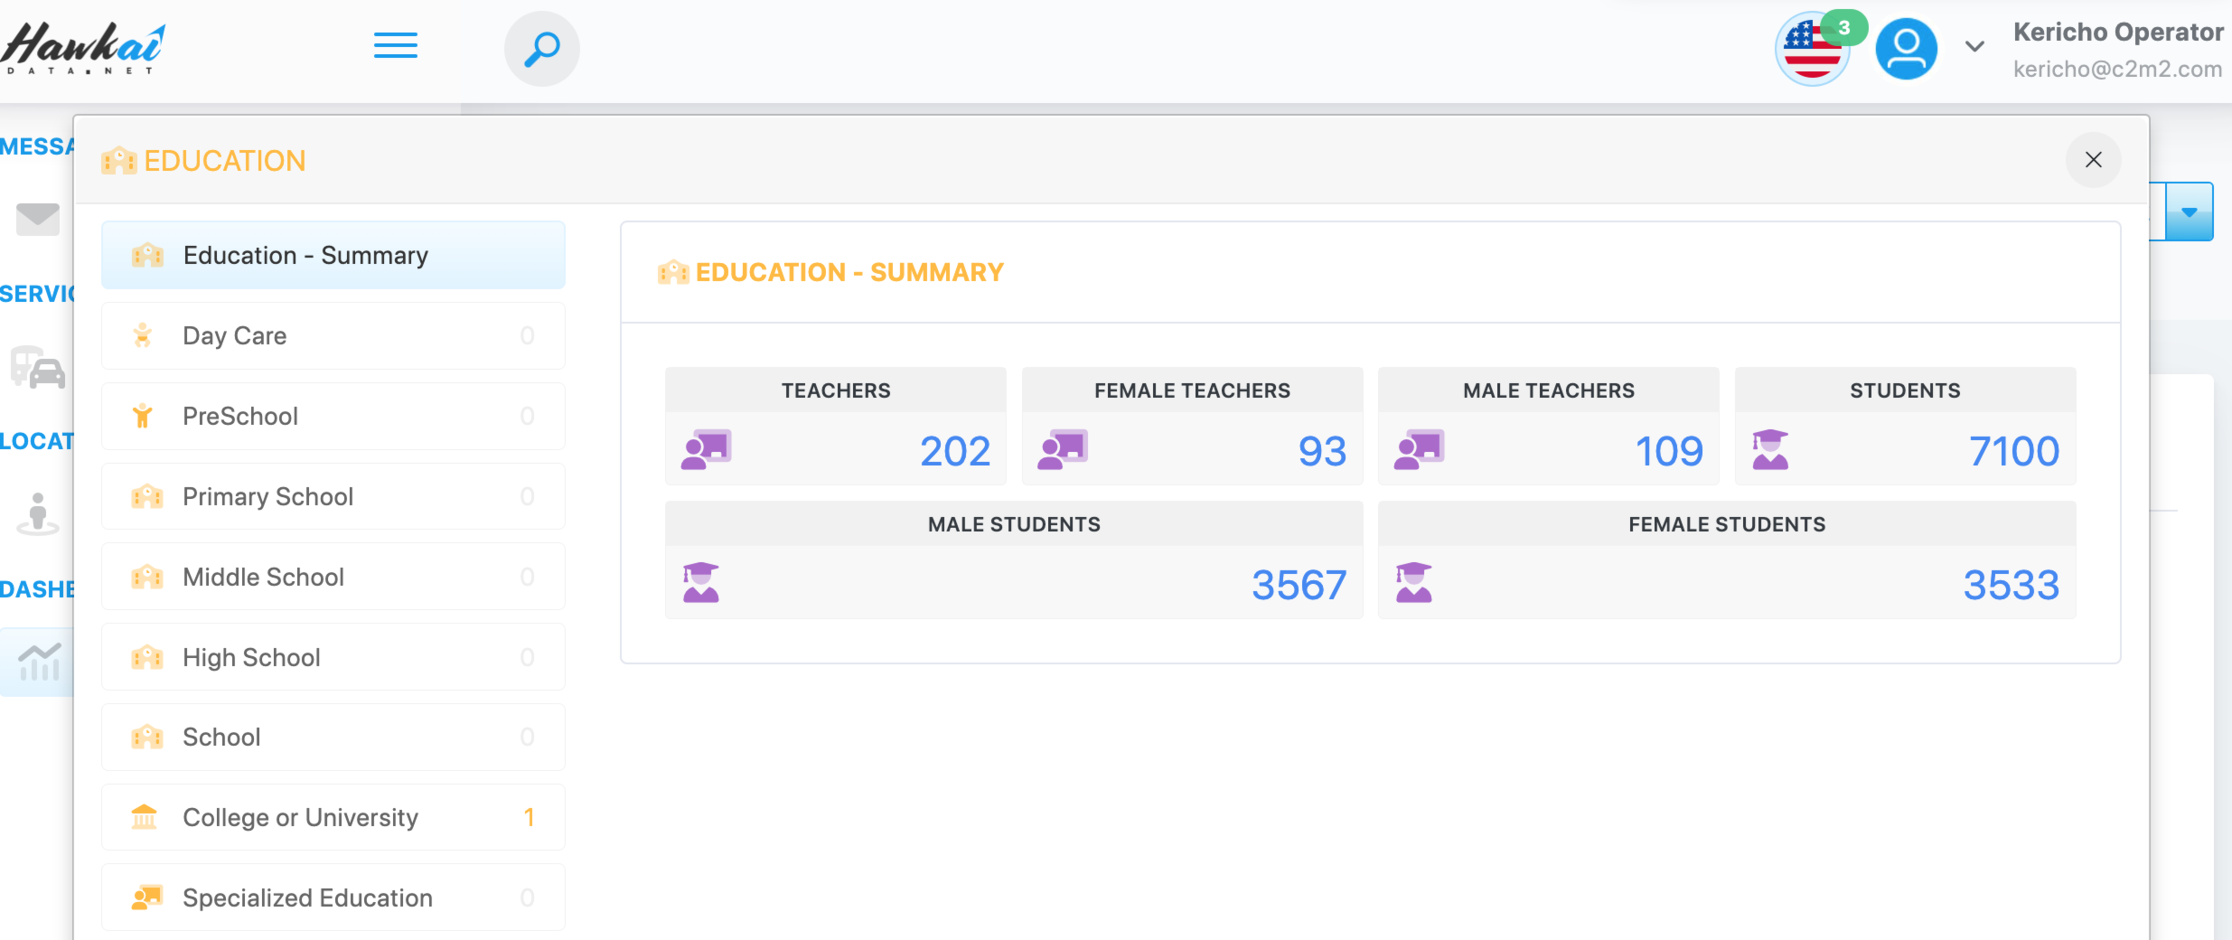
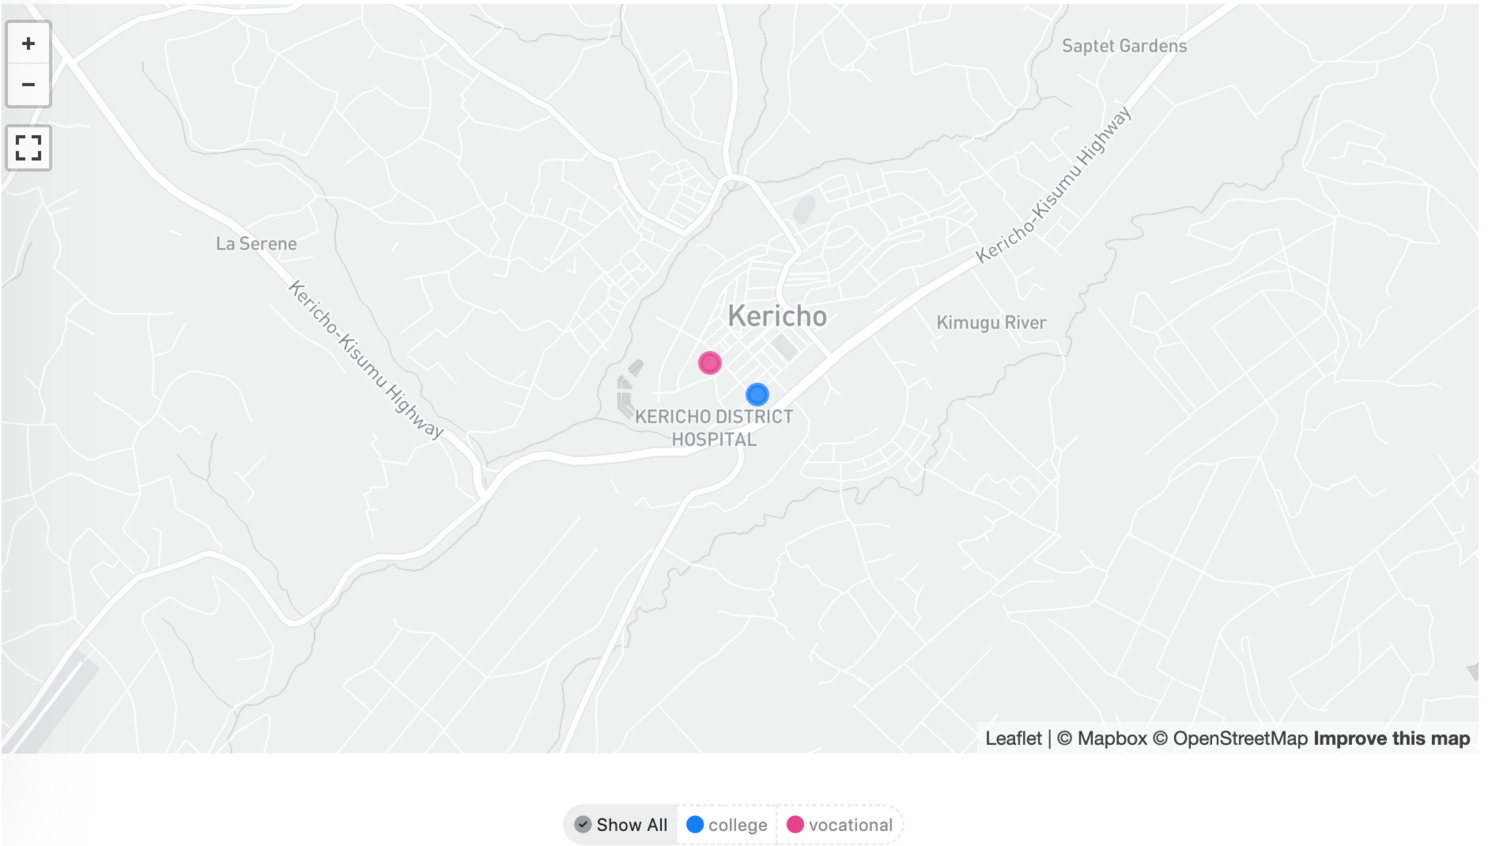
SDG 5 (Gender Equity) Dashboard
SDG 6 (Water and Sanitation) Dashboard
SDG 7 (Energy for All) Dashboard
Community Services
Scaling the Pilot
- Complete – Completeness is about the data being comprehensive. Are all the facilities of interest in the area of interest recorded and accounted for? Are all the required fields filled?
- Consistent – Consistency is about assuring that different data collectors represent data in the same way and in the same formats. If an image is taken, are all images taken consistently in landscape mode? If a telephone number is required, is all data recorded with the country and area code included? Are there duplicate listings? Are all addresses entered consistently?
- Correct – Correctness is about accuracy of the information. Does the latitude/longitude accurately locate the facility?
- Current – Currency of data has to do with timeliness. Is the data provided current as to when the data was recorded? Currency becomes important when data is collected on a periodic basis.
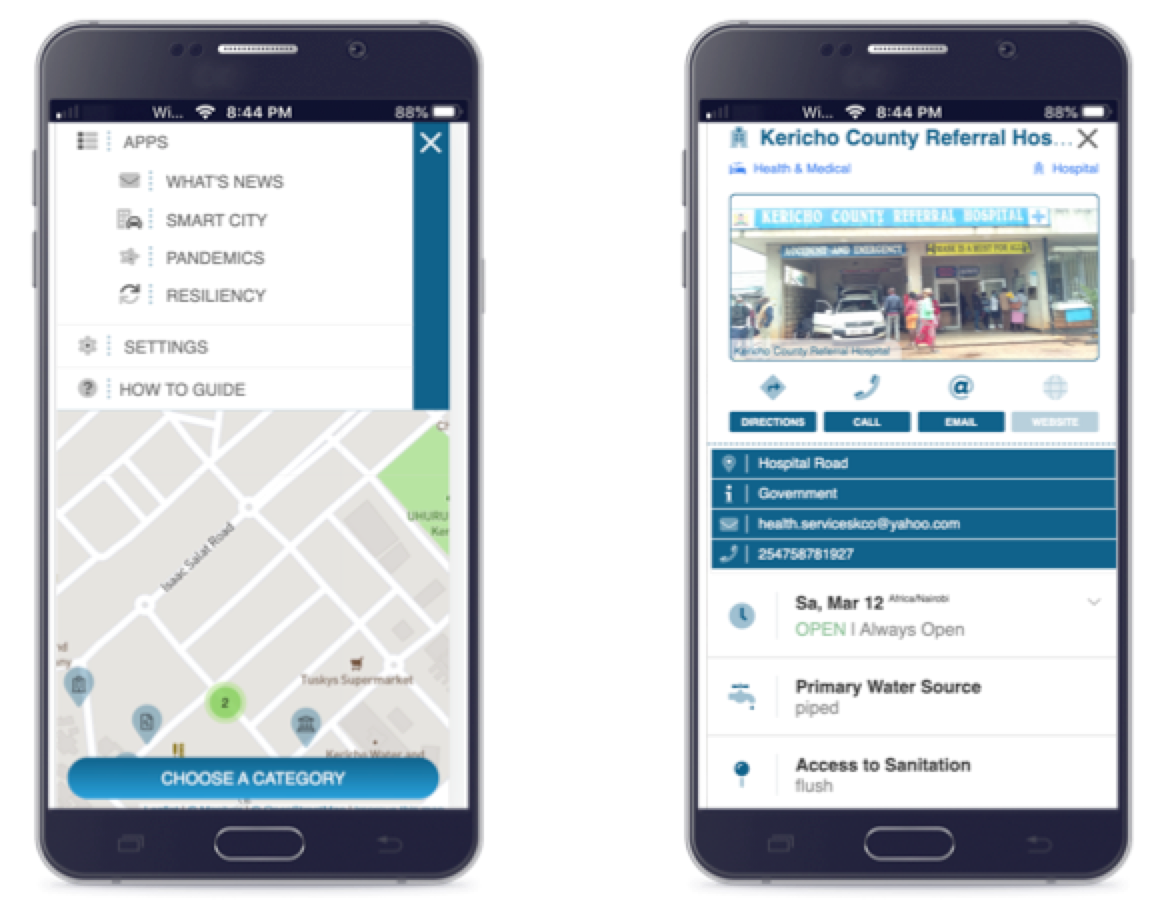
The facility-based data model provides a simple and sustainable process that countries can use to measure SDG progress and also use to quantify the impact of social programs and investments. The Kericho pilot when scaled to include all counties in a country will provide key insights, identify regional gaps and vulnerable populations, and enable focused social investments that can have the most impact. In addition, facility registries can be used to create mobile apps that users can use to find facilities of interest, check resource availability, and communicate with the facility.
Acknowledgements
This research was possible thanks to the Cities’ Covid Mitigation Mapping (C2M2) program, developed by the U. S. Department of State’s Humanitarian Information Unit and the American Association of Geographers (AAG). The pilot was done jointly with our partners UASG Advisors and DDD.
UASG Advisors focuses on process improvement and digital transformation to drive organizational efficiencies. Since 2017, UASG Advisors has provided strategic leadership and project oversight for US State Department funded projects in Africa. UASG Advisors set up the Africa Hub for the US State Department, established local partnerships and setup the process for geospatial data gathering and analysis across multiple countries in Africa.
Digital Divide Data (DDD) is a non-profit social enterprise that provides outsourced data collection, data preparation, and digitization services. DDD has teams across 9 countries with the ability to scale operations across multiple locations and countries. DDD clients include Fortune 100 companies, category market leaders and NGOs.
References
Apollonia Miola, Fritz Schiltz, Measuring sustainable development goals performance: How to monitor policy action in the 2030 Agenda implementation?, Ecological Economics, Volume 164, 2019, 106373, ISSN 0921-8009, https://doi.org/10.1016/j.ecolecon.2019.106373.
Gaston Mbonglou, Ranjit John. Data and dashboards for measuring the social impact of COVID-19 in African cities. The Geographies of COVID-19 -- Geospatial Stories of the Global COVID-19 Pandemic. Springer;2022;Chapter 11.